Tokenguard: Ultimate growth & data analytics tool for Substrate
- Team Name: Tokenguard.io (Block Solutions Sp z o.o.)
- Payment Address: PL83249010570000990157469781 (USD IBAN; Alior Bank; SWIFT / BIC: ALBPPLPW)
- Level: 2
Project Overview 📄
This application is a response to the RFP by Keegan Quigley: https://grants.web3.foundation/docs/RFPs/Under Development/analysis-website-and-data-platform.
Overview
Absence of a user-friendly on-chain analytics platform is an existing challenge of the Polkadot & Kusama ecosystems. Currently, querying data through GraphQL and backend services like Subquery and Subsquid requires considerable effort. Creating compelling and visually attractive dashboards is almost impossible due to lack of tools that focus on end user experinece. As a result, power-users and builders face difficulties in interactively accessing high-quality data and creating custom visualizations for easy sharing.
To address this challenge, we propose an easy-to-use and efficient solution - an advanced data analytics tool designed to cater specifically to the needs of the Polkadot & Kusama ecosystems and related parachains. Our platform offers seamless data querying, simplifying the creation of customized charts and visualizations, facilitating easy sharing of valuable insights and metrics within the community.
With the aim of ensuring extensive accessibility across the Substrate community and optimizing the functionality of our analytical tool, Tokenguard application places a strong emphasis on refining the UX aspect. This involves the development of an intuitive user interface (UI) and seamless frontend that effectively facilitates insights discovery.
Project Details
To meet the expectations of Polkadot and Kusama community and the suggestions contained in the RFP, we propose a comprehensive analytics tool consisting of a query builder, visualization creator and dashboard composer for Polkadot & Kusama ecosystems - the creation of which requires the implementation of the following features.
Features that will be built using this specific grant are in bold.
-
Data model:
- Creating a RAW data access that would categorize data depending on its depth:
- L0: Relay chains (Polkadot, Kusama)
- L1: Parachains
- L2: dApps & Smart Contracts
- Creating a database of pre-transformed, comparable & curated metrics - each of the metric would be a pre-defined SQL query based on RAW data that is curated by Tokenguard team:
- User related metrics
- Activity related metrics
- Conversions related metrics
- Creating a RAW data access that would categorize data depending on its depth:
-
Metrics
- Creation:
- Allowing users to create their own SQL queries from scratch and save them.
- Allowing users to preview SQL query of each of the existing metrics at Tokenguard.
- Allowing users to copy, edit and save each of the existing metrics.
- Collection:
- List of projects on different depths (L0, L1, L2)
- List of RAW tables available for these projects
- List of comparable metrics for these projects
- Creation:
-
Dashboards
- Making it possible for people to create & share dashboards with their own metrics:
- Providing a description and schema of required API response. The response consists of all possible measures and dimensions for future visualization.
- Creating a frontend which allows user to select series of data for axis X and Y for visualization.
- Allowing user to select type of visualization for the data among 5 types (linechart, barchart, piechart, multiline chart, stacked barchart).
- Designing frontend to layout visualizations on canvas (using drag & drop or any other method that is more comfortable for the user).
- Saving dashboard related data on backend to allow frontend transform database metrics into attractive visualisations.
- Making it possible for people to create & share dashboards with their own metrics:
-
Users
- Creating a user subpage with a list of users' dashboards & metrics
- Displaying user stats
Beta Version - existing Tokenguard features
(You can access public version of Tokenguard app at app.tokenguard.io)
Over the course of six months, Tokenguard application was meticulously developed with the objective of creating a user-friendly analytics tool for the Substrate Ecosystem, without requiring any coding or SQL skills. Within this timeframe, we successfully produced a beta version of the app, which now offers essential on-chain analytics for various projects within the Polkadot ecosystem, such as Astar, Aleph Zero, Nodle and many others.
Features and designs:
Dashboards overview - The overview of currently indexed and supported parachains:

Ecosystem metrics dashboards - The on-chain data is visually presented through charts that are categorized into the most significant and essential aspects:

Filtering - The ability to sort data based on the most useful indicators:

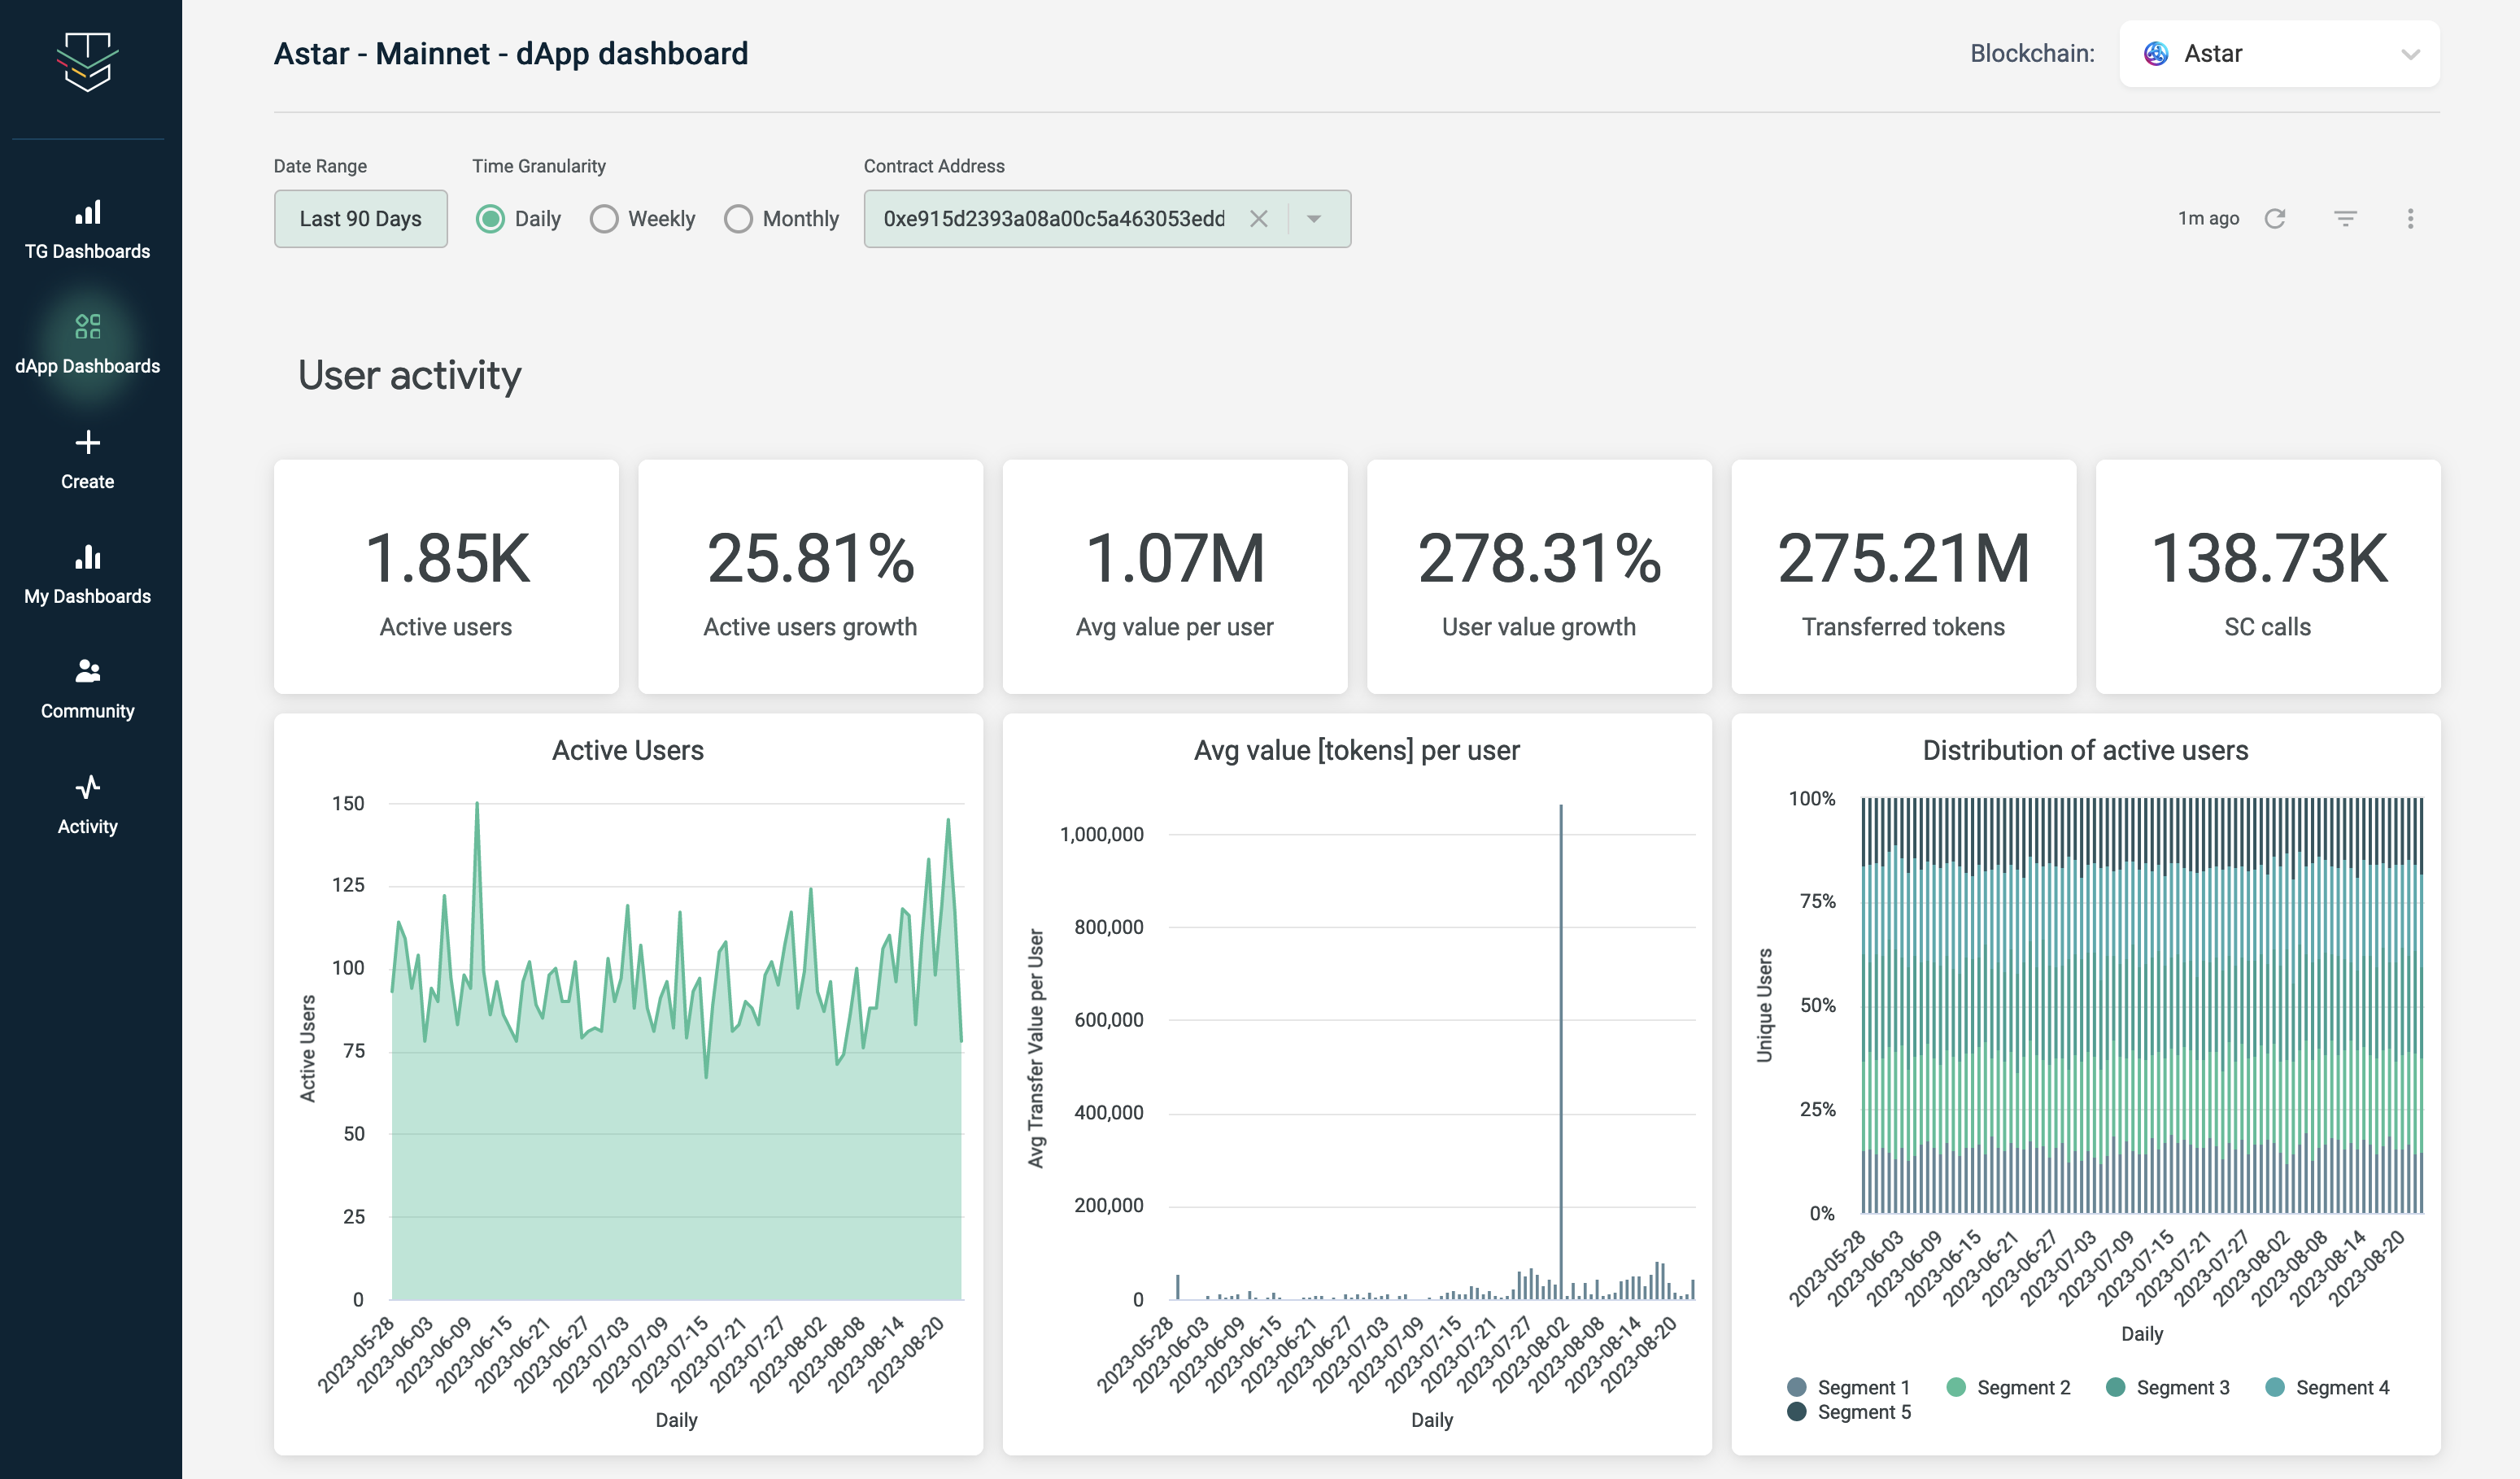
User activity analytics - A module that allows for an in-depth analysis of user behavior based on metrics such as DAU, MAU, retention or user segments:
Proposal mockups - new standalone features:
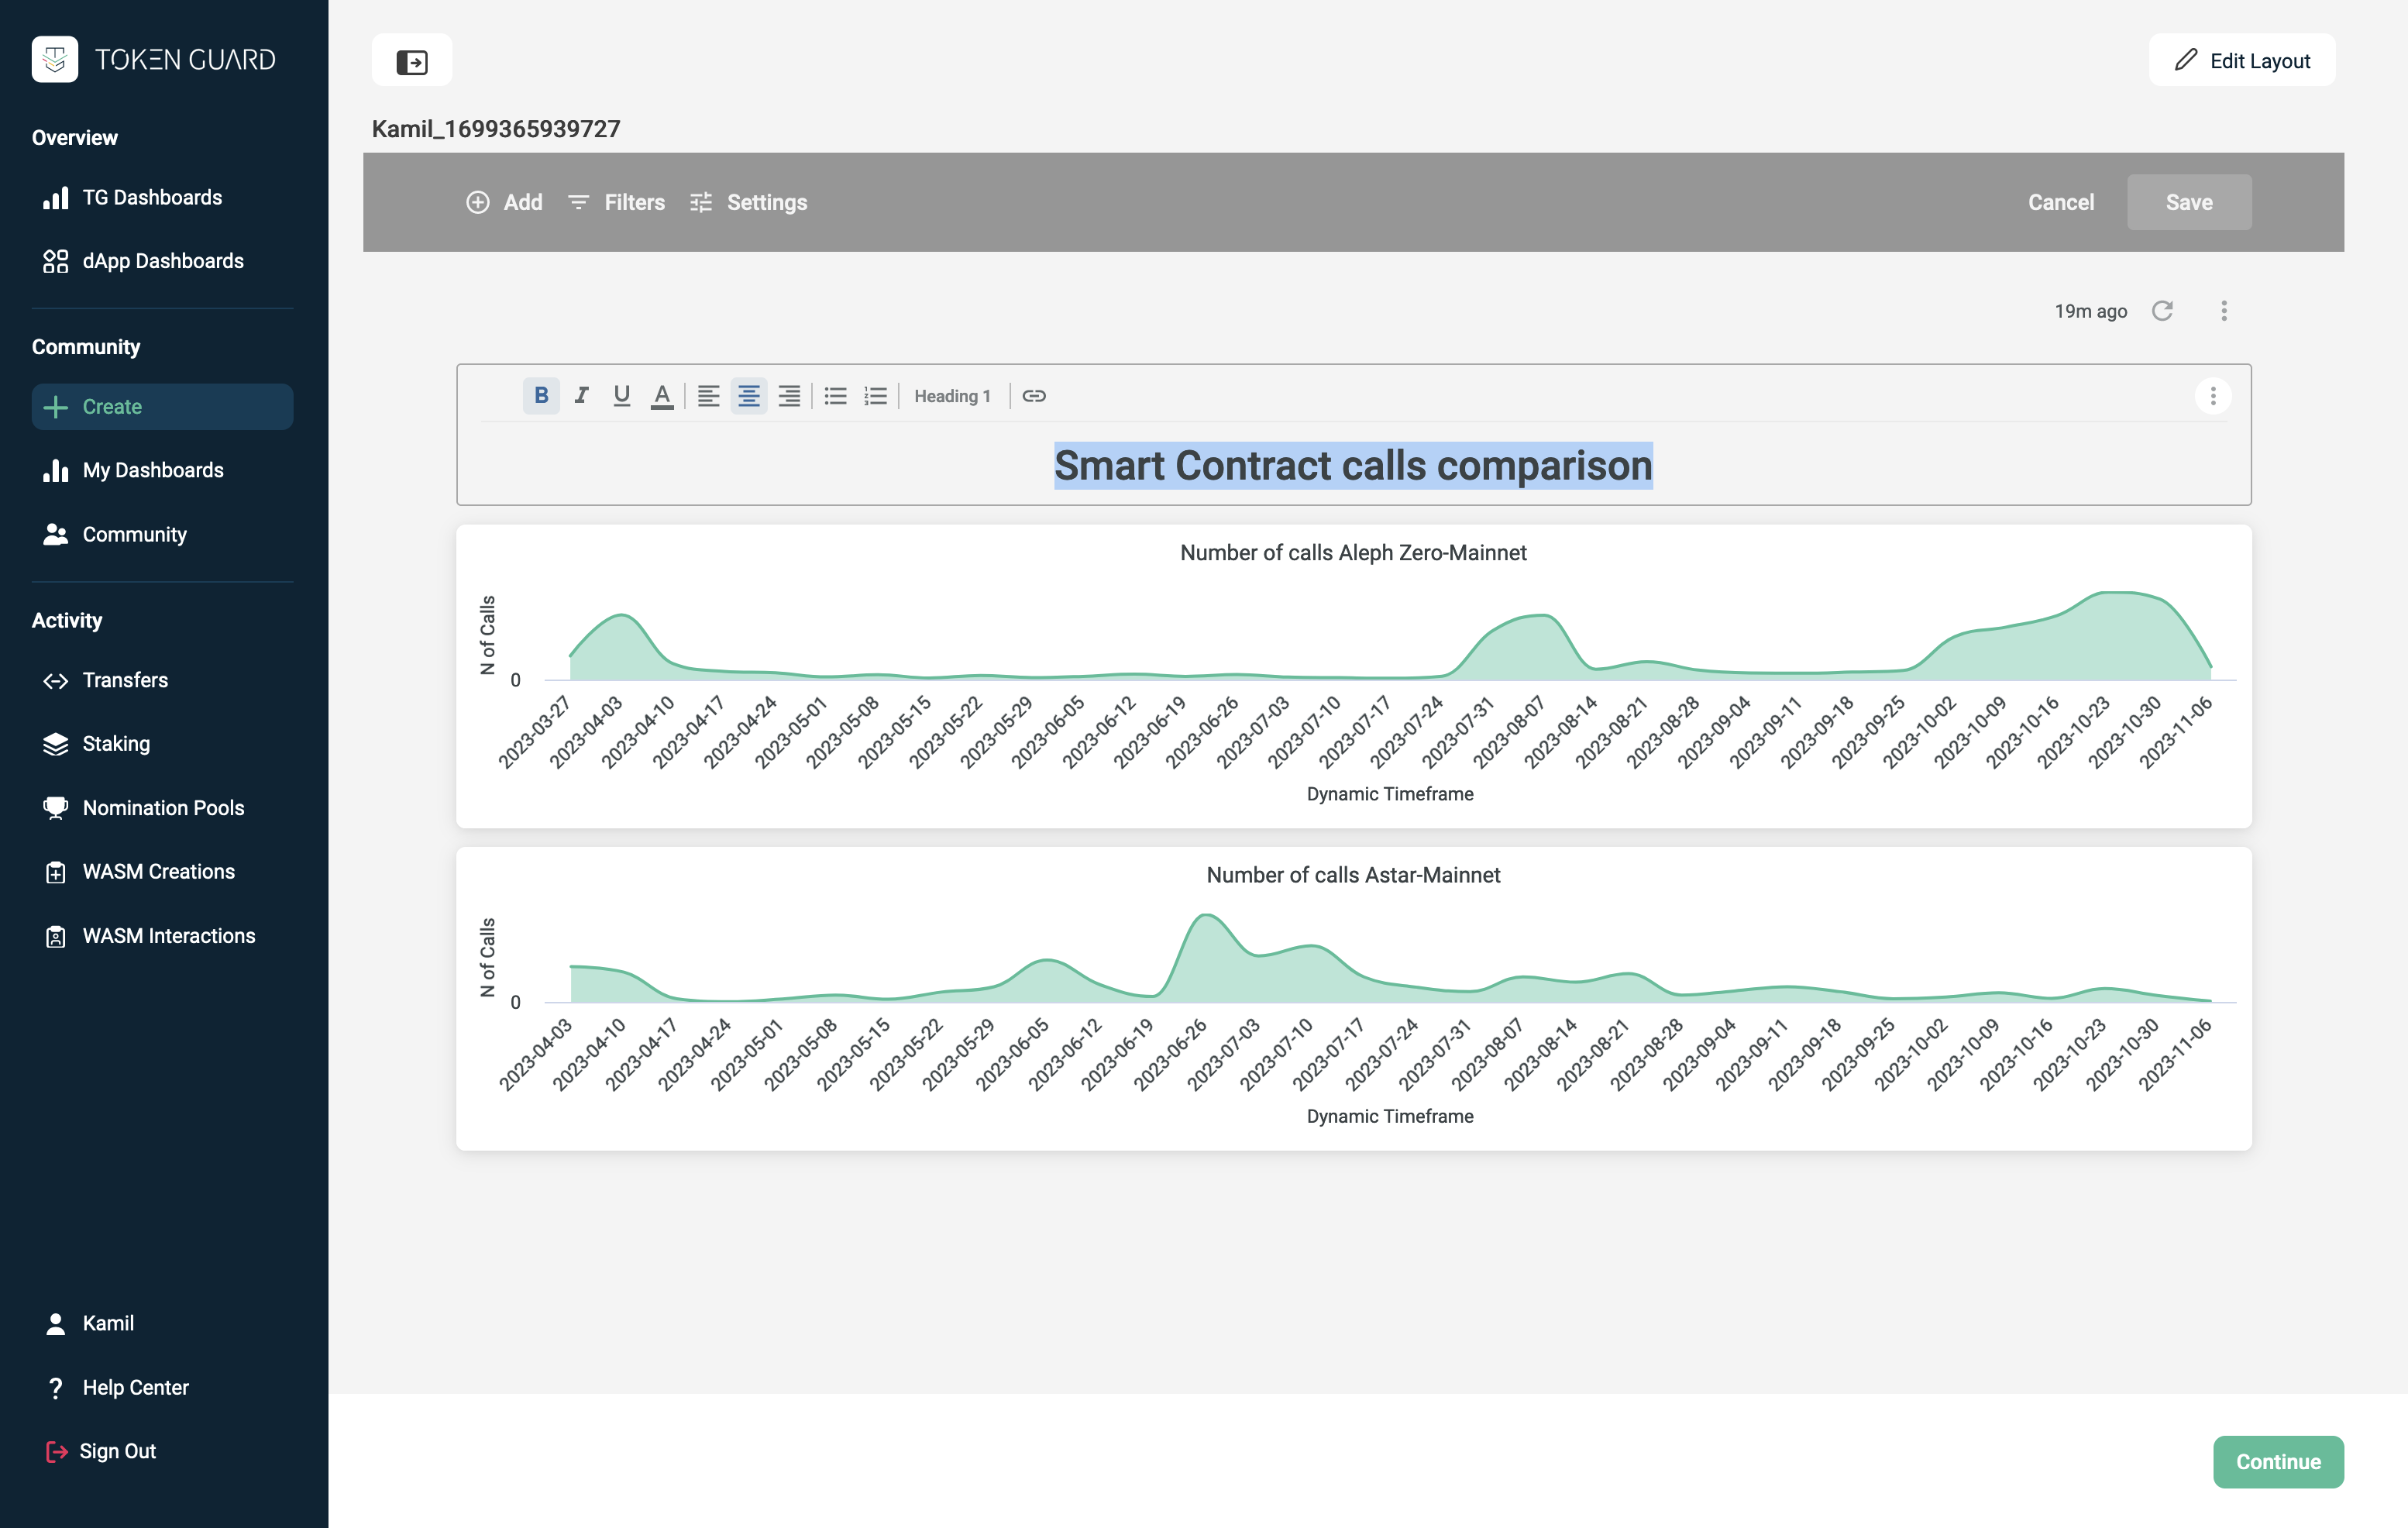
Dashboard creator - The drag and drop feature allows users to add metrics onto the dashboard:

Layout composer - Allowing for an easy modification of the dashboard's layout:

Technology Stack:
- JavaScript, TypeScript, Python
- SQL, dbt, Airflow
- Kubernetes
- SubSquid
- BI analytics tools
- Cloud hosting and scalable infrastructure
Other Proposals Comparison
RFP has been partially addressed by other teams in the proposals #1716 #1768 #1748 #1815 and work is underway to solve it. Being aware of how wide and complex the area of data analysis is, in our solution, we wanted to refer to the issues and propose modules that have not yet been built, but will complement the ongoing work.
Compared to the following, Tokenguard in this proposal provides both a user-friendly no-code dashboard composer and visualisation composer - which UX / UI is designed in an accessible way, reaching a wide audience.
Features created in this proposal will support other data-related projects, making it easier for them to attract Polkadot & Kusama users:
-
#1716 - is an ETL tool that focuses on delivering the Polkadot ecosystem data to a wide audience using Google BigQuery service.
-
#1768 - is an ETL tool focused on deep account analytics challenges.
-
#1748 - is a data analytics tool that focuses on wallet profiling and tracking its investments and structure.
-
#1815 - is a low-level SQL query editor and vizualization creator dedicated for data engineers and developers.
Ecosystem Fit
In order to facilitate growth, Substrate ecosystem needs a vast and thriving environment of developers creating parachains, dApps and smart contracts. Each parachain and each smart contract generates thousands of transactions that store important technical and business insights. Each new growing dApp, with its own marketing & growth strategy, brings in new active users to the ecosystem and venture capital money. These insights are currently hard to discover and the ecosystem needs infrastructure tools that would make it easy for management teams and developers to uncover them, similarly as it is done in EVM environment with tools like Dune Analytics or Tenderly.
Tokenguard addresses the need of following audiences:
Community:
- Transparency & Credibility:
- Access to data and on-chain insights is the basis for a community driven blockchain.
- The ability to track and verify activity and growth in the parachains reinforces trust.
- Investment:
- A tool that gives access to the performance of individual dApps and DeFi allows for a better investment decisions.
- A tool that gives access to the performance of individual dApps and DeFi** allows for a better assessment of the market situation in terms of investment.
- Insights into data on developer activity and TVL allows to attract additional community members who want to invest in the ecosystem.
- Engagement:
- A well-informed community is more likely to be involved in the building programs on a given chain and in ongoing activities.
- Access to insights allows the community to actively promote chain in social media, at events and in ordinary media.
Relay chains, parachains and dApps teams:
- Marketing Improvements:
- Off-chain to on-chain data correlation provides a deeper understanding of the marketing and PR efforts that contribute to the network’s growth
- Developer engagement tracking allows to identify strategies that encourage web3 creators to build within the ecosystem.
- User segmentation and user behavior tracking allows to understand which protocols and dApps generate the most usage in the network and what type of user affects its growth.
- More efficient Treasury Spending:
- Tracking the inflow of new users through dApps and on-chain projects financed through treasury grants of relay and parachains allows measuring spending success.
- Source of reliable data to support discussion and decisions during treasury votings.
- Strengthening Operations & Security:
- Real-time monitoring and alerts enable the team to respond more effectively in the face of potential threats such as rug pulls.
- Thanks to access to on-chain insights, such as a TVL in DeFi or a Smart Contract creation per developer, Tokenguard helps understand how to better optimize the operations of parachains for individual entities.
Tokenguard's public features and data are already being used by community users and projects like DotInsights (https://dotinsights.subwallet.app/polkadot-report-q2-2023-en/):

Team 👥
Team members
- Kamil Gorski - CEO (https://www.linkedin.com/in/gorskikamil/)
- Jakub Rojek - CTO (https://www.linkedin.com/in/jakub-rojek-dev/)
- Damian Rolek - CDO (https://www.linkedin.com/in/damianrolek/)
- Matt Saczewski - Business Development Manager (https://www.linkedin.com/in/msaczewski/)
- Jacob Piorecki - UI/UX Designer (https://www.linkedin.com/in/jacobpiorecki/)
- Piotr Józefowicz - Backend Developer (https://www.linkedin.com/in/piotr-jozefowicz-529669220/)
- Adam Król - Backend Developer (https://www.linkedin.com/in/adam-król-7b3a831b6/)
- Krystian Trepczyński - Frontend Developer (https://www.linkedin.com/in/krystiantrepczynski/)
Contact
- Contact Name: Matt Saczewski
- Contact Email: matt@tokenguard.io
- Website: tokenguard.io
Legal Structure
- Registered Address: Foksal 3/5 St., 00-366 Warsaw, Poland, EU VAT ID PL7252284130
- Registered Legal Entity: Block Solutions Sp z o.o.
Team’s experience
Tokenguard’s clients include Swiss Sygnum Bank, Bitcoin.com, Astar, Aleph Zero and many others recognizable brands. Each of cofounders has tremendous web3 experience - Damian was co-creating DeFi analytics platform Kasuria. Jacob was working at OpenLoyalty, helping web3 projects engage their users and Kamil created web3 security solutions, designing a security monitoring that served 30+ tokens.
Current Traction & Business Model
Our current business model focuses on offering growth analytics solutions for parachains & dApps and allowed us to validate both product and services through collaborations with notable parachains such as Astar and Aleph Zero. We believe that delivering free of charge community analytics will further enhance discovery of growth insights within the whole ecosystem, allowing it to win the race for leading position in the web3 space.
Teams we cooperate with appreciate our flexibility and user-oriented approach:
 Tokenguard is the missing part for Astar ecosystem. Its analytics and tracking capabilities provide us with the crucial insights needed to understand on-chain activity and user behavior, allowing us to make data-driven decisions and optimize our strategies like never before.
Maarten Henskens, Head of Foundation, Astar Network
 We are happy to use Tokenguard, which offers Aleph Zero comprehensive on-chain user metrics and engagement data. Thanks to their analytics tool, we can make data-driven decisions and provide transparency to our community with easy-to-use dashboards.
Antoni Zolciak, CMO, Aleph Zero
Team Code Repos
Development Status 📖
Tokenguard is currently developing the following features:
- Publicly accessible core analytics for Substrate communities, available at https://app.tokenguard.io
- Ecosystem Analytics for Astar - paying customers
- Ecosystem Analytics for Aleph Zero - paying customers
- Ink! dApp analytics for AZero ID, ArthSwap, Panjea, Interlock and others
- Partnership with SubSquid
Development Roadmap 🔩
Having a lot of experience in building web3 products, our team is aware that there are many challenges behind building a fully functional analytics platform similar to Dune for an ecosystem as vast and diverse as Polkadot & Kusama. We acknowledge the fact that a lot of questions need to be answered and W3F requirements need to be specified to fully estimate the cost of creating such a solution that will be easily upgradable and basically - fun for users. We therefore propose to split the work on the project into 3 composable grants / proposals:
- Dashboard builder
- Metrics creator & catalogue
- Universal data model & ETL (work underway from other projects)
This proposal is the first part that is solely focused on preparation of the dashboard creator, helping us and other teams deliver the data to users in an attractive form.
Overview
- Total Estimated Duration: 2 months
- Full-Time Equivalent (FTE): 1.5 FTE
- Total Costs: 30,000 USD
Milestone 1: Frontend
- Estimated duration: 2 months
- FTE: 1.0
- Costs: 20,000 USD
| Number | Deliverable | Specification | TechStack |
|---|---|---|---|
0a. | License | MIT | --- |
0b. | Documentation | We will provide inline documentation. | --- |
0c. | Testing and Testing Guide | Core functions will be fully covered by comprehensive unit tests to ensure functionality and robustness. We will describe how to run these tests. | --- |
0d. | Docker | We will provide a Dockerfile that can be used to test all the functionality delivered with this milestone. | --- |
1. | Metrics visualisation | Allowing visualisation from RAW data: 1. Data selection interface for user including axis and scale setup, 2. Creating a preliminary visaulisation design standard of common data types, 3. Preparing 5 customisable visualisation types which include linechart, barchart, piechart, multiline chart, stacked barchart. 4. Creating a mechanism to customize the visualisations for differently branded projects | ReactJS, MongoDB, Apache ECharts |
2. | Dashboard layout | Creating a dashboard composer which allows: 1. Creating, saving, modifying and deleting new and existing dashboards, 2. Populating a dashboard with visualised metrics with drag & drop method, 3. Modifying the dashboard layout - changing the positions of charts, resizing and deleting them. 4. Enriching the dashboard with captions, titles and links. | ReactJS, React Grid Layout, MongoDB |
Milestone 2: Backend
- Estimated Duration: 2 weeks
- FTE: 1.5
- Costs: 10,000 USD
| Number | Deliverable | Specification | TechStack |
|---|---|---|---|
0a. | License | MIT | --- |
0b. | Documentation | We will provide inline documentation. | --- |
0c. | Testing and Testing Guide | Core functions will be fully covered by comprehensive unit tests to ensure functionality and robustness. We will describe how to run these tests. | --- |
0d. | Docker | We will provide a Dockerfile(s) that can be used to test all the functionality delivered with this milestone. | --- |
1. | API reading mechanism | Connecting frontend visualisations with underlying data through an API: 1. Description and schema for an API response, 2. Saving and modifying visualisation related data, 3. Saving and modifying dashboard related data, 4. Collecting user data in relation to dashboard and chosen metrics. | NodeJS, Express, OpenAPI, MongoDB |
3. | Report & estimation | Detailed report on the dashboard composer design and cost estimation of all the features mentioned in "Project details" as well as additional features requested by Web3 Foundation. | --- |
Future Plans
Analytics for Polkadot & Kusama ecosystems
The module implemented under this proposal lays the foundation for covering the entire Polkadot & Kusama ecosystem with accessible and user-friendly tool for on-chain insights and analysis. PoC of query builder, visualization creator, dashboard composer for Polkadot and Kusama Relay Chains enables further scaling of the analytical tool to the entire ecosystem.
The next steps will consist of a proposal to create a common dataset of metrics for each category of pallets/parachains; creating a more complex query builder, automated/semi-automated process of new parachain & dApp inclusion; automated/semi-automated process of user-requested tables aggregation; indexing and maintaining a database for the entire ecosystem (in cooperation with the Parity team).
Making web3 grow
At the same time, continuing the current activities, Tokenguard will offer its services to provide custom dashboards with advanced features to subsequent parachains in order to improve their marketing and operational activities.
With backing up of well-known web3 investors, Tokenguard is on its path to help web3 ecosystems and dApps understand their user behavior and focus on product & marketing strategies that deliver organic growth.